By the end of the 2012/13 fiscal year, approximately five years had passed since the announcement of the Provincial Transit Plan. The PTP targets were to be achieved by 2020, which means that this period represents just over one-third of the total. Therefore, a basic expectation would be that the provincial government would have spent approximately 33.3 percent of the projected budget for the Provincial Transit Plan. However, it should be noted that expenditures often do not follow a smooth growth pattern, and therefore, this estimate is very approximate. It is used to give a basic sense of where things are at by this point in time in relation to the overall expectations for the plan’s implementation.
Capital funding
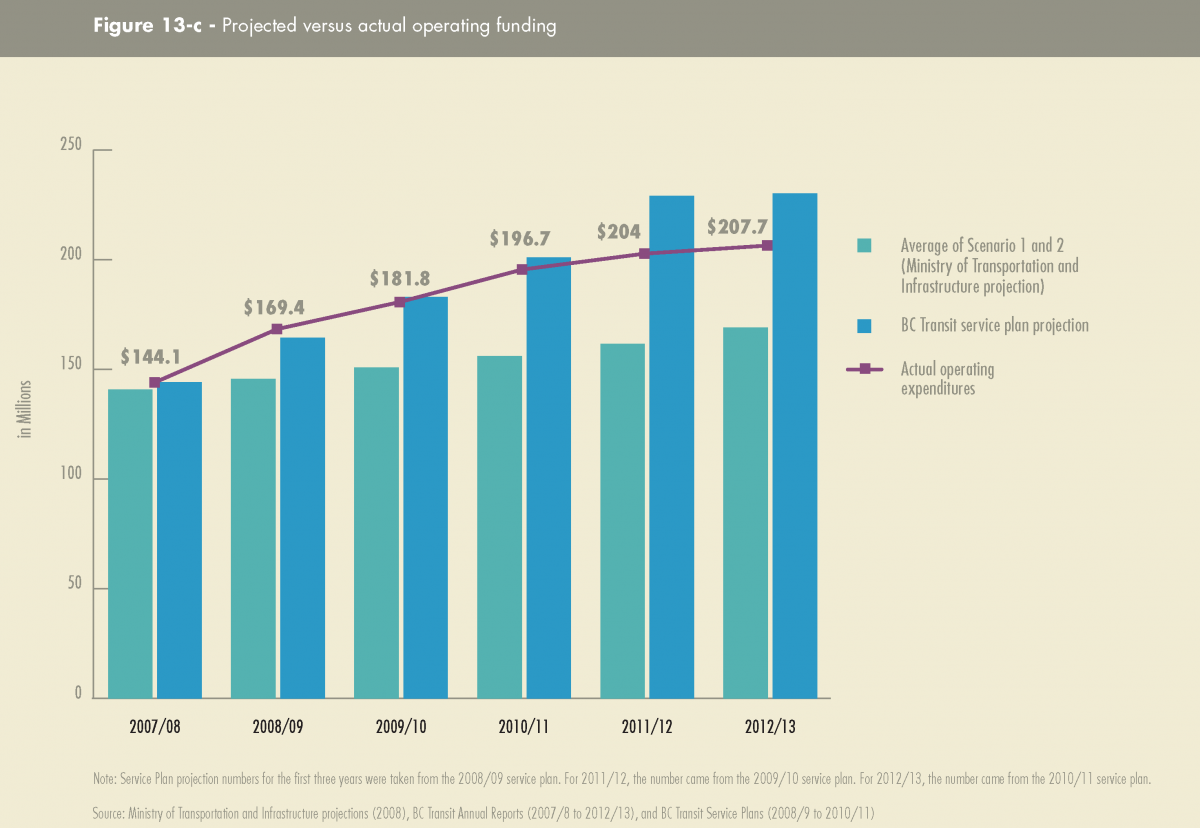
Figure 13-a - Projected versus actual fleet expenditures to 2012/13 (click image to enlarge)
The above chart shows that the number of buses purchased to the end of the 2012/13 fiscal year was 93 percent of the projected Provincial Transit Plan total for BC Transit, while the cost of the bus purchases was 42 percent of the anticipated total. This suggests that the cost for bus replacement and expansion has been lower per bus than was expected.
Total capital expenditures (includes BC Transit and TransLink)
|
Expected costs (PTP)
|
Total capital expenditures for PTP expansion to 2012/13 (BC Transit and TransLink)
|
Total capital expenditures for PTP Expansion to 2012/13 (BC Transit only)*
|
BC Transit's proportion of total PTP capital expenditures to 2012/13
|
Provincial expenditures on PTP capital projects to 2012/13 compared with PTP estimate
|
|
$4750 million
|
$441.88 million
|
$49.81 million
|
11%
|
9%
|
*In addition to the amounts in the table, the provincial government has contributed over $151 million toward asset replacement for BC Transit, largely to replace obsolete buses.
Source: OAG calculations from Ministry of Transportation and Infrastructure and BC Transit information
The above table suggests that total capital expenditure towards the Provincial Transit Plan goals has been lower than the 33.3 percent that would expected by the end of 2012/13, if a third of the money were to be spent by this point. However, the expectation was that the expenditures would not be distributed evenly across the period of implementing the plan. Instead, 13 percent was to be spent in the first four years, and 53 percent in the final four years. Two of the largest rapid transit projects within TransLink’s area of operation were not expected to begin until after 2015/16.
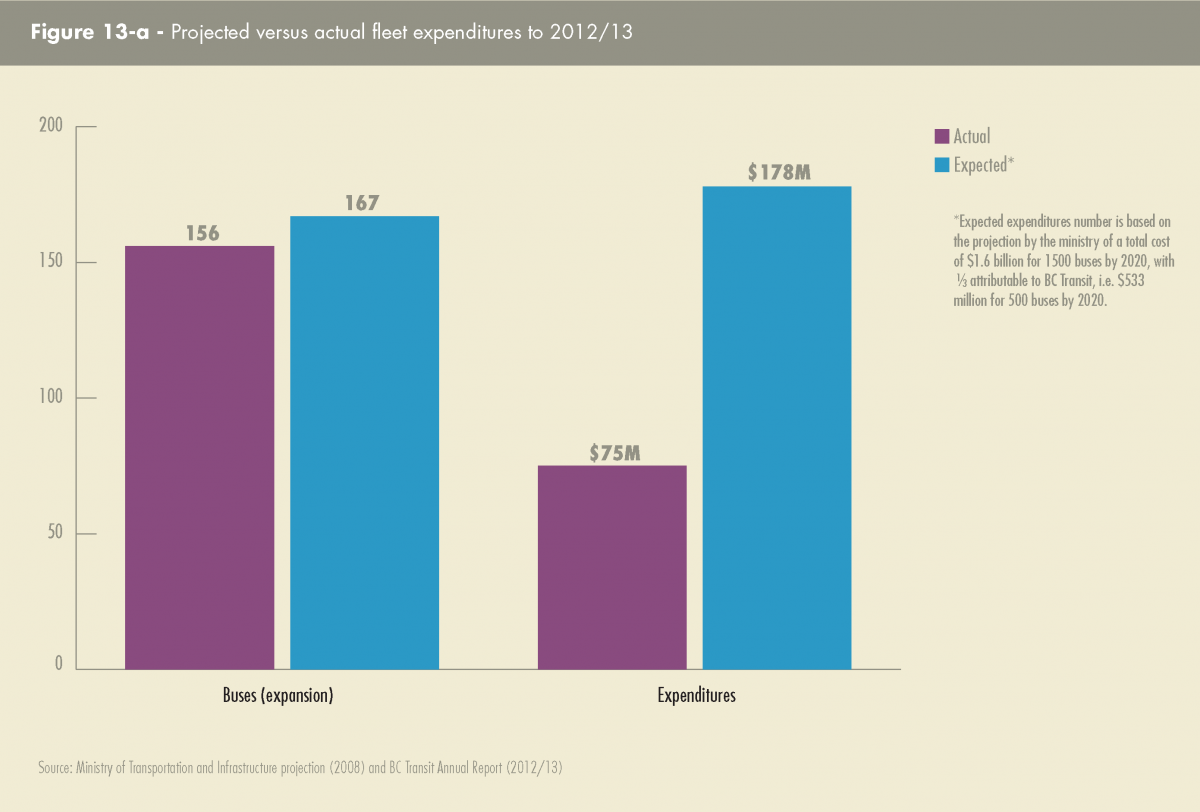
Municipal and federal governments also contribute to capital expenditures (municipal governments make their contribution through debt service payment). $47.63 million was the total capital expenditure for BC Transit for 2012/13. The amounts contributed by the different parties are determined on a project by project basis. Therefore, each year, the provincial and local government proportions would be different. In 2012/13, the proportions contributed by each partner are shown in the pie chart below.
Figure 13-b - Share of capital expenditures 2012/13 (click image to enlarge)
Operating Funding
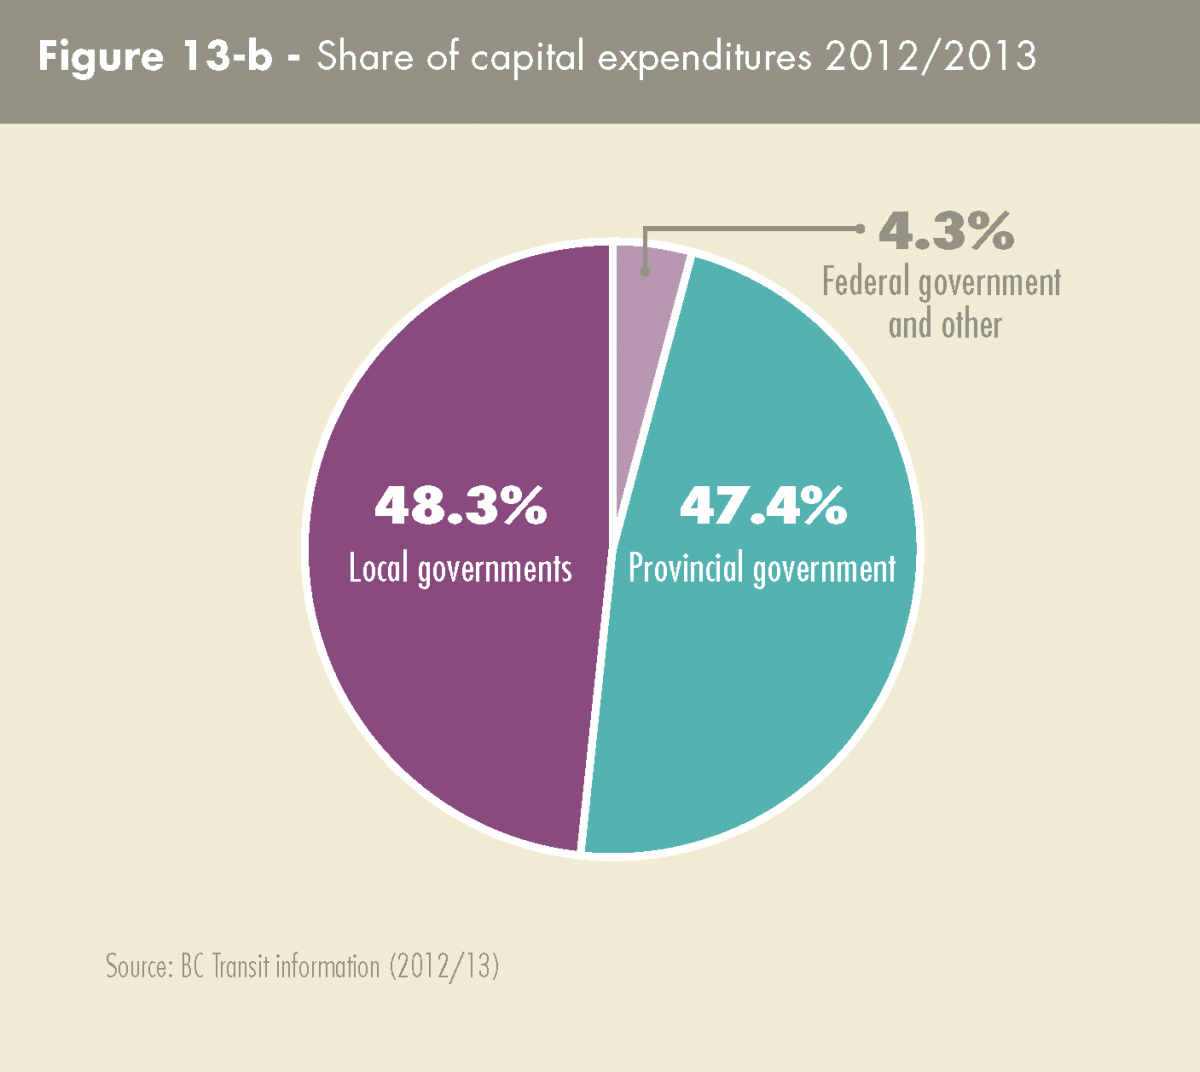
There was no specific commitment in the Provincial Transit Plan with respect to operating funding costs to support the anticipated expansion of transit services. It is possible to compare, however, the projections for operating costs by the Ministry of Transportation and Infrastructure in the scenarios it developed in 2007/08, and the projections set by BC Transit in its service plans, with the actual operation expenditures annually since 2007/08.
Figure 13-c - Projected versus actual operating funding (click image to enlarge)